A new report from the US Department of Energy’s (DoE) Lawrence Berkeley National Laboratory shows a major expansion of solar-plus-storage facilities in the US power plant market.
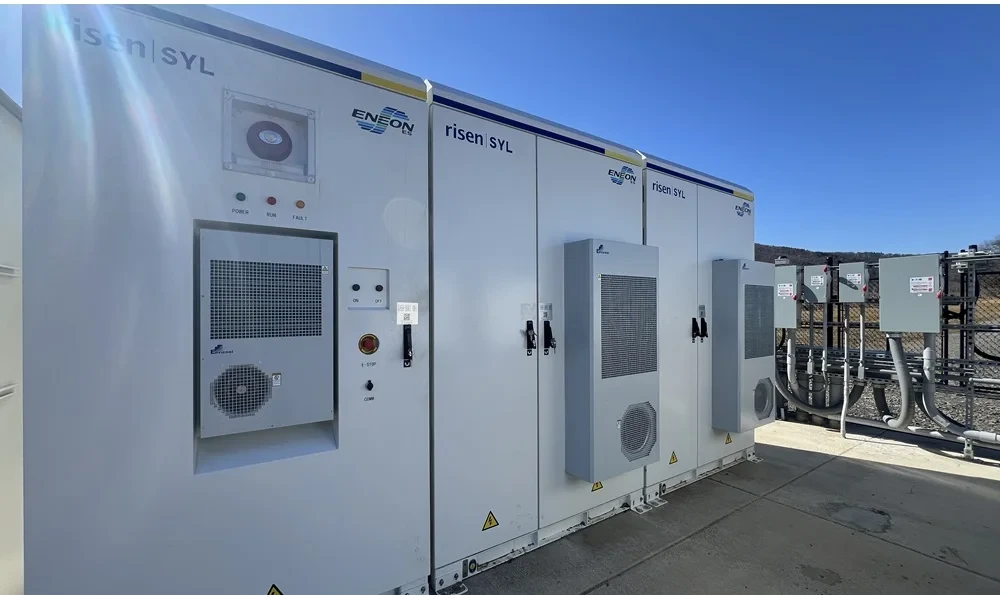
Image: Commercial Solar Guy
From pv magazine USA
Within the United States, data from the Lawrence Berkeley National Laboratory’s energy market and policy team (EMP) indicates that there are currently 469 hybrid power plants in operation in the United States.
About 61% of hybrid plants, or 288 facilities, are solar-plus-storage projects. These plants represent the majority of energy storage capacity, with 7.8 GW and 24.2 GWh of energy deployed nationwide. In 2023, 66 of the 80 new hybrid projects were PV-plus-storage systems.
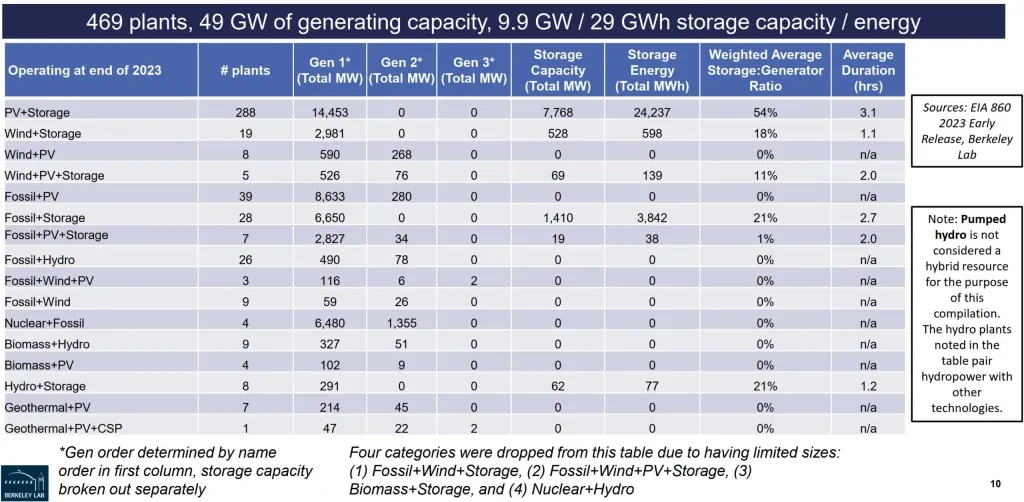
The “Hybrid Power Plants: Status of Operating and Proposed Plants 2024 Edition” draws on data from the US DoE’s Energy Information Administration (EIA), as well as annual reports on the nation’s interconnection queues.
The expansion of solar-plus-storage facilities gained momentum in 2020, initially driven by smaller projects in Massachusetts. This trend has been amplified by California, Texas and Florida, where the introduction of larger-scale facilities has significantly boosted overall capacity. Notably, Massachusetts hosts 89 of the nation’s 288 solar-plus-storage facilities, each with less than 7 MW of capacity. These installations are encouraged by the state’s SMART program, which promotes energy storage with advantageous DC to AC ratios and battery integration.
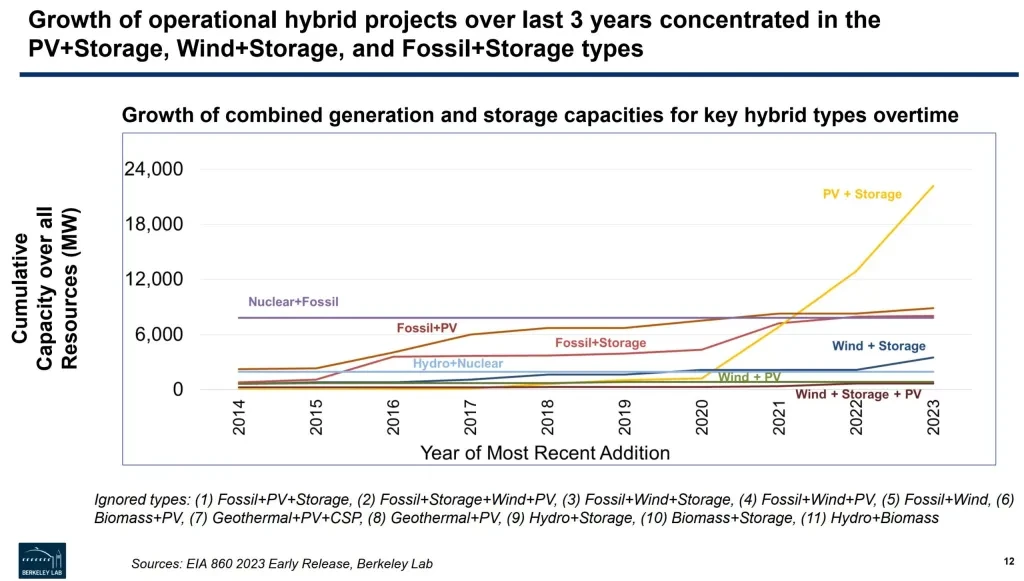
California follows as the state with the second-highest number of solar-plus-storage facilities, totaling 72. Unlike Massachusetts, nearly half of these West Coast facilities exceed 100 MW of solar capacity. Arizona and California are leading in the number of new solar-plus-storage hybrid plants, with 15 and 16 new facilities coming online, respectively.
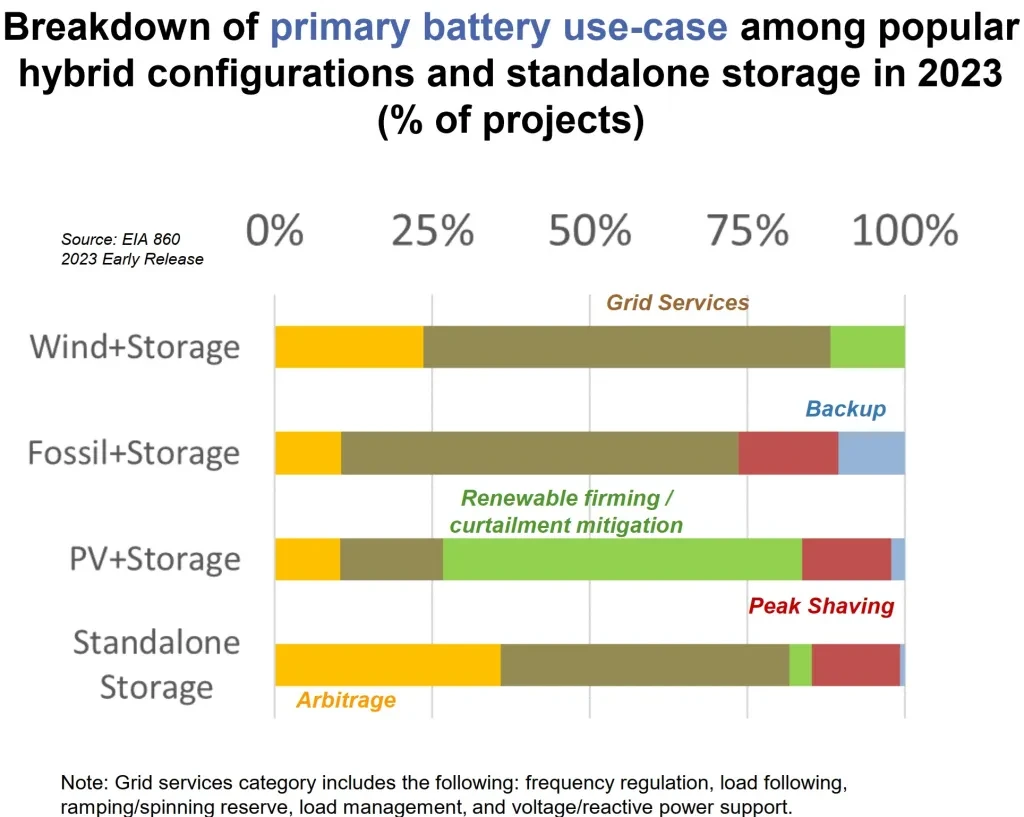
The usage of plants is evolving, both overall and sometimes individually. There has been a national shift from primarily using energy storage for frequency regulation to increasingly using it for arbitrage, accompanied by growing curtailment of solar facilities. This is particularly significant in solar power plants where storage helps capture energy that might otherwise be curtailed and stabilizes the generation profile of the solar facilities.
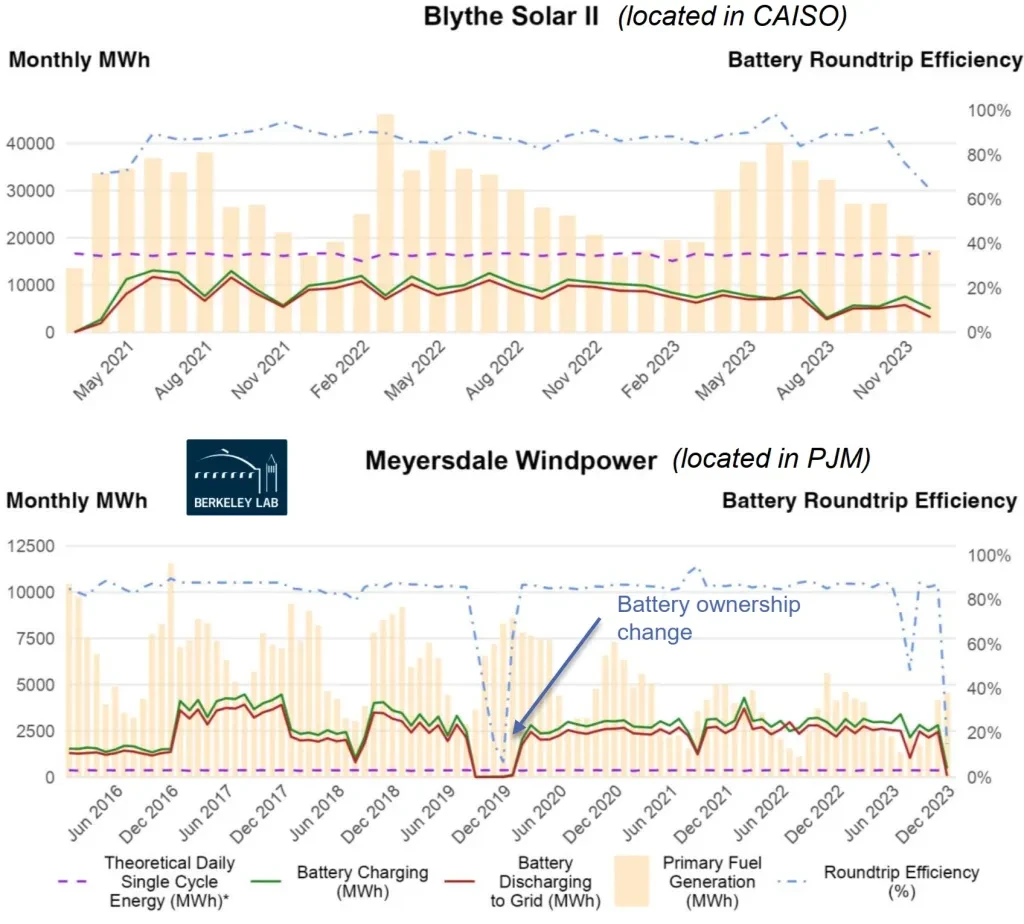
The EMP report features case studies of individual power plants, including Blythe Solar II and Meyersdale Windpower, with detailed performance data shown in the graphs below. Blythe Solar II, a 131 MW (AC) solar plant with 115 MW/528 MWh of storage, added storage in 2021 to its 2016 solar infrastructure. The plant cycles its batteries less than once per day, aligning this with peak solar hours and evening demand for energy arbitrage that matches CAISO wholesale pricing and solar shifting. However, the EIA lists frequency regulation as the plant’s primary function, with arbitrage as secondary.
Meyersdale Windpower, a 30 MW wind facility with an 18 MW/12.1 MWh battery added in 2015, operates differently from Blythe. Its battery cycles an average of six times per day, and up to twelve times under certain conditions. The EIA identifies frequency regulation as the primary and sole function of Meyersdale’s battery, which aligns with its frequent cycling.
Going forward, the capacity is clean and coupled with storage.
In California, the utility-scale solar market has effectively transformed into a solar-plus-storage market, with almost all new projects featuring hybrid systems. The residential PV sector is also catching up, with a 60% storage attachment rate.
The report said national interconnection queues are moving toward California’s hybrid power plant model. Currently, 47% of future capacity is planned as hybrid plants, with 92% being solar-plus-storage facilities. Of the 2.5 TW total in the queue, 2 TW are solar and storage configurations, either standalone or hybrid, signaling a future dominated by these technologies.
Future energy storage pricing trends, which have seen significant declines and are expected to continue, are driving these interconnection queue submissions. In 2024, investments in solar are projected to exceed $500 billion, ensuring the growth of solar-plus-storage facilities through lower hardware costs and improved solar module efficiency.
However, in the short term, pricing for solar-plus-storage facilities has experienced a slight increase.

The EMP team analyzed pricing data from 105 solar-plus-storage power purchase agreements, representing 13 GW of solar and 7.8 GW/30.9 GWh of energy storage. Pricing for hybrid systems has risen since 2020, partly due to higher battery storage capacities, driven by the cost of additional hours of lithium storage. Although variations in battery usage complicate the analysis, supply chain inflation also likely contributed to the price hikes.
Despite these rising costs, the growing number of new energy storage projects shows that the market remains strong, with capacity continuing to expand.
This content is protected by copyright and may not be reused. If you want to cooperate with us and would like to reuse some of our content, please contact: editors@pv-magazine.com.
Source from pv magazine
Disclaimer: The information set forth above is provided by pv-magazine.com independently of Chovm.com. Chovm.com makes no representation and warranties as to the quality and reliability of the seller and products. Chovm.com expressly disclaims any liability for breaches pertaining to the copyright of content.


 বাংলা
বাংলা Nederlands
 English
 Français
 Deutsch
 हिन्दी
 Bahasa Indonesia
 Italiano
 日本語
日本語 한국어
한국어 Bahasa Melayu
 മലയാളം
 پښتو
پښتو فارسی
فارسی Polski
 Português
 Русский
 Español
 Kiswahili
 ไทย
ไทย Türkçe
 اردو
اردو Tiếng Việt
 isiXhosa
 Zulu
Zulu